We’ve made it to May 2022 at Walt Disney World! With spring break season now officially over, we thought it’d be worthwhile to recap April wait time data in the parks. This report covers daily crowd levels and average attraction wait times for last month at Magic Kingdom, Epcot, Hollywood Studios, and Animal Kingdom, focusing on the last two weeks while also offering a look forward at what to expect in the month to come month.
You might notice that this is the first Walt Disney World crowd report in a while to have an optimistic title. Most have included phrases like “worst month,” “busiest week,” “spring break peak,” or “not off-season.” These haven’t been hyperbolic, but rather, a reflection of wait time data.
Unfortunately, January was elevated significantly as compared to last year, February was the busiest month in the last two years, and then March managed to top it and be even worse. Those two months had average wait times of 45 and 46 minutes, respectively. For those wanting to put those numbers into historical context, the average wait times for the entirety of 2020 and 2021 were 33 and 32 minutes, respectively.
Unsurprisingly, April 2022 started out with a bang. As indicated in our last crowd report, the month had an average daily wait time across all rides at Walt Disney World of 45 minutes. That was as of the start of Easter week, and our expectation was that it would only get worse from there.
Let’s dig into the data to see where April wait times ended the month. As always, all graphs and wait time stats are courtesy of Thrill-Data.com.
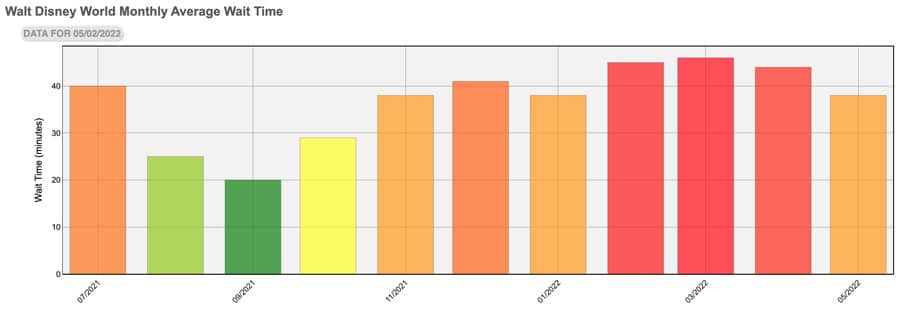
Above is a high level look at monthly wait time averages across the entirety of Walt Disney World.
Our expectation was incorrect. Wait times actually dropped at Walt Disney World in the second half of April. Granted, it was only by 1 minute, but that includes Easter, which is typically one of the year’s worst weeks.
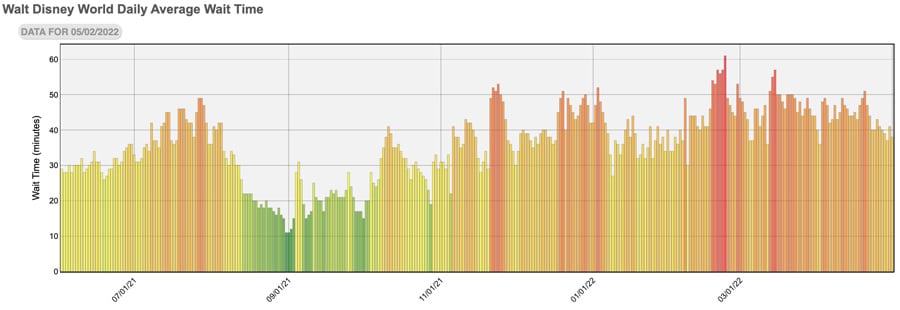
Once we get into individual days, you can see the precise point at which spring break crowds dropped off.
Interestingly, the drop occurred on April 20. That’s the middle of the week after Easter, so it neither coincided with the end of the holiday week nor spring break for the Northeastern and Midwest school districts that still had spring break the following week.
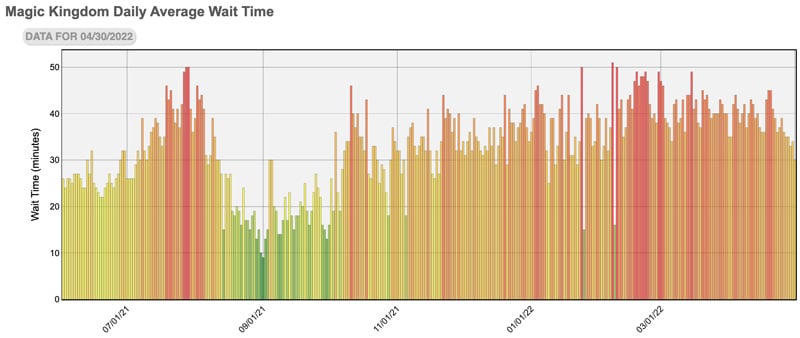
For park by park analysis, we’ll start with Magic Kingdom.
As with Walt Disney World as a whole, Magic Kingdom wait times hit a 9/10 level on April 20 and have been falling since. These days been downright average, with lots of 6/10 or 7/10 crowd level days in the last two weeks. The first day of May 2022 was the lowest level day since early February at 4/10!
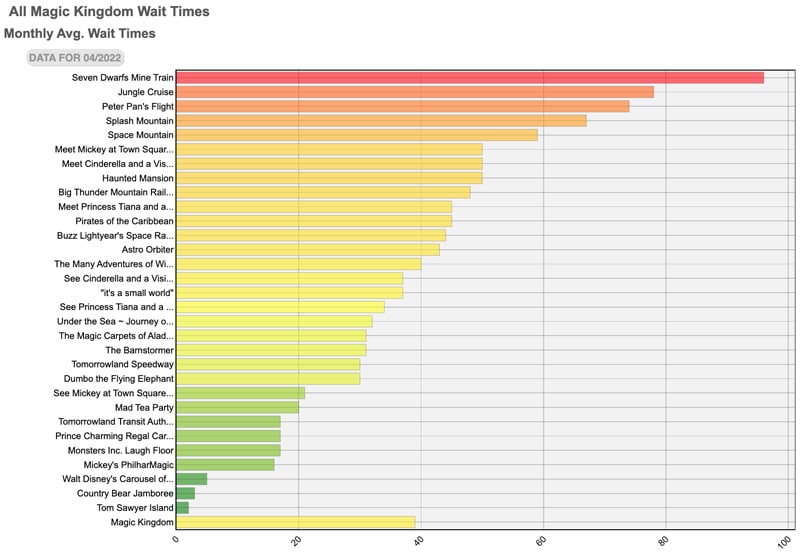
Here are the specific averages for April 2022:
- Seven Dwarfs Mine Train: 96 minutes
- Jungle Cruise: 78 minutes
- Peter Pan’s Flight: 74 minutes
- Splash Mountain: 67 minutes
- Space Mountain: 59 minutes
- Meet Mickey at Town Square Theater: 50 minutes
- Meet Cinderella at Princess Fairytale Hall: 50 minutes
- Haunted Mansion: 50 minutes
- Big Thunder Mountain Railroad: 48 minutes
Note that two meet & greets made this list, despite not being on it the first half of the month. As predicted, wait times for characters soared once those returned to normal on April 18.
You can actually spot the differential as the attraction names changed from “See [character name]” to “Meet [character name].” Look at how low the former is on the rankings as compared to the latter, and that’s despite the “See” option occurring during peak crowd levels and “Meets” starting during the off-peak dates.
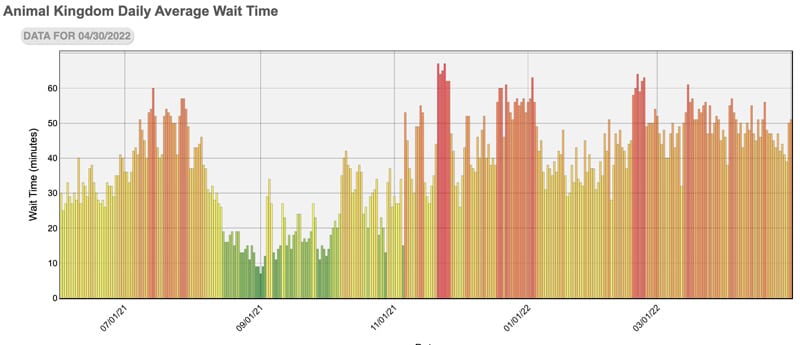
It’s a similar story at Animal Kingdom.
There, wait times also fell considerably from their spring break levels. For the last two weeks, crowd levels were in the 5/10 to 7/10 range. (Technically, there was a spike to 8/10 on both of the last two days. No good explanation for that–it didn’t happen at the other parks.)
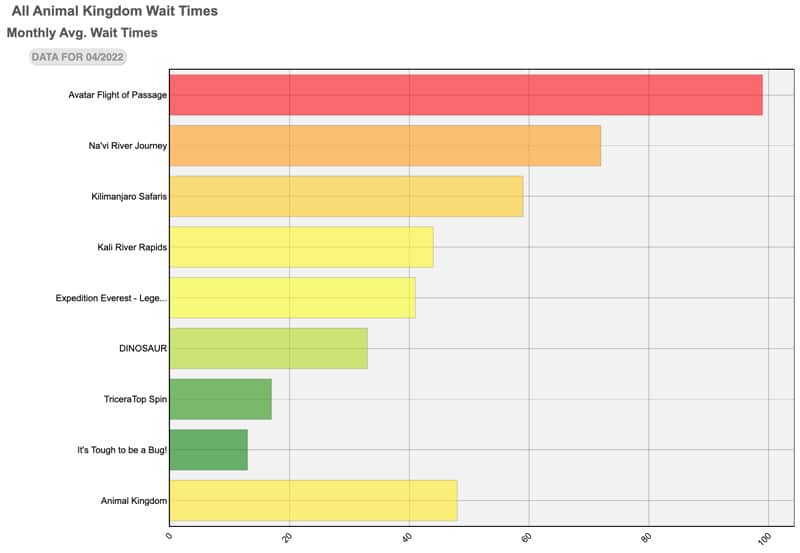
Here are the specific averages for April 2022:
- Avatar Flight of Passage: 99 minutes
- Na’vi River Journey: 72 minutes
- Kilimanjaro Safaris: 59 minutes
- Kali River Rapids: 44 minutes
- Expedition Everest: 41 minutes
- Dinosaur: 33 minutes
The few other attractions in Animal Kingdom are all below 20 minutes.
I don’t know about you, but it’s mildly amusing to me that Expedition Everest went from being the park’s second Individual Lightning Lane attraction (never selling well in that spot) to the 5th highest wait time in a park with only 8 measured wait times.
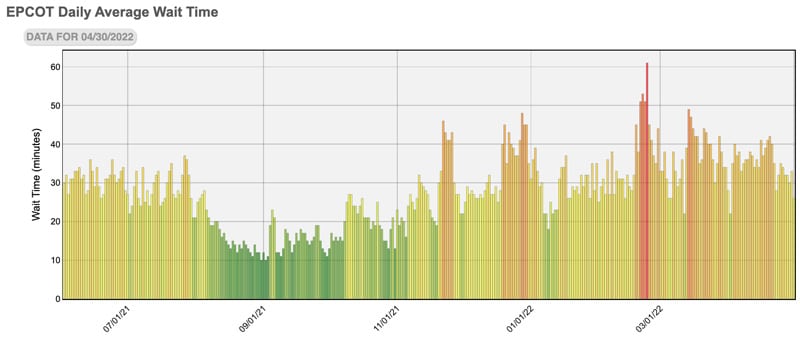
We continue along to Epcot.
Pretty much the exact scenario played out at Epcot. April 20 was a 9/10 crowd level, and every day since has been markedly lower. There have been days as low as 4/10, but the numbers have really been all over the place. With the 2022 Epcot Flower & Garden Festival now being “old news” to most locals, the decision to pepper Guardians of the Galaxy: Cosmic Rewind previews throughout mid-May makes sense. Those dates will help prop up attendance.
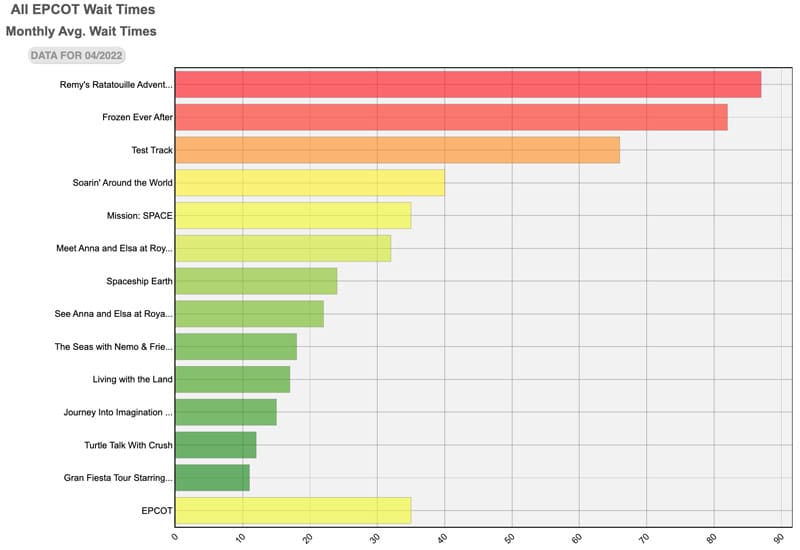
As for specific attraction wait times at Epcot, here’s what we have for the first half of April 2022:
- Remy’s Ratatouille Adventure: 87 minutes
- Frozen Ever After: 82 minutes
- Test Track: 66 minutes
- Soarin’ Around the World: 40 minutes
- Mission Space: 35 minutes
- Meet Anna & Elsa at Royal Summerhaus: 32 minutes
Again, there’s a big difference between the “See Anna & Elsa” and “Meet Anna & Elsa” character greetings despite the former occurring while crowd levels were markedly higher.
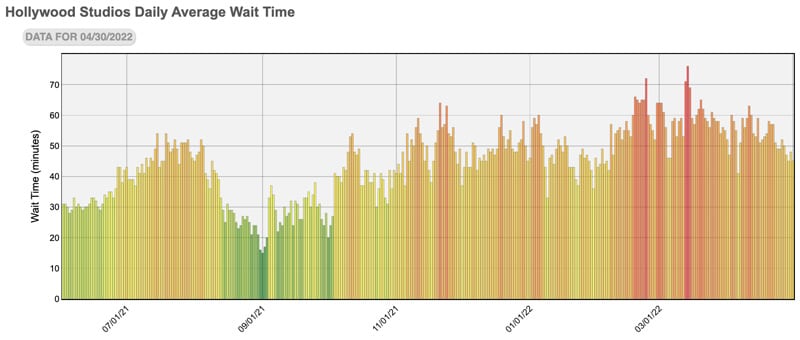
Finally, there’s Disney’s Hollywood Studios.
If you’ve visited DHS in the last two weeks, you’ve benefited from a significant reprieve in wait time levels. There’s a good chance you didn’t realize it, as Disney’s Hollywood Studios can be unpleasant during the middle of even a “decent” day, but wait times dropped from a peak of 76 minutes to a range of 45-57 minutes in the last two weeks. When you add it all up, that’s a huge difference.
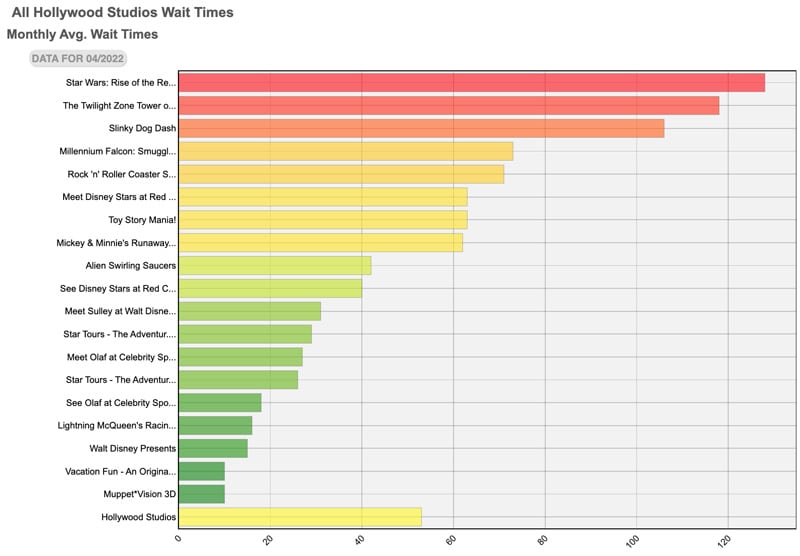
Here are ride-by-ride wait times for Disney’s Hollywood Studios in April 2022:
- Star Wars: Rise of the Resistance: 128 minutes
- Twilight Zone Tower of Terror: 118 minutes
- Slinky Dog Dash: 106 minutes
- Millennium Falcon Smugglers Run: 73 minutes
- Rock ‘n’ Roller Coaster: 71 minutes
- Meet Disney Stars at Red Carpet Dreams: 63 minutes
- Toy Story Mania: 63 minutes
- Mickey & Minnie’s Runaway Railway: 62 minutes
- Alien Swirling Saucers: 42 minutes
While still very high, keep in mind that these are numbers for the entire month. There’s only so much the last two weeks can do to take down the average after the sky-high start to April. With that said, here are a few notes about DHS wait times:
- Twilight Zone Tower of Terror is so high because it’s operating at half-capacity due to a “stealth” refurbishment. It’ll likely remain at this level through at least the first half of summer.
- Rock ‘n’ Roller Coaster remained elevated because it was down a lot the second half of the month, so it didn’t benefit from lower daily numbers to drag down its monthly average.
- The (excellent) Red Carpet Dreams featuring Mickey & Minnie takes the cake for the longest meet & greet wait time of the month.

As a reminder, the 8 am official park opening time makes it easier to minimize wait times at Disney’s Hollywood Studios, especially if you’re staying on-site. See our post on Early Entry at Disney’s Hollywood Studios that covers doing both Star Wars: Rise of the Resistance and Mickey & Minnie’s Runaway Railway before the park opened to regular guests. (Although now you’d be better suited bouncing from Galaxy’s Edge to Sunset Boulevard rather than Grauman’s Chinese Theatre.)
Additionally or alternatively, there’s Genie+ and Lightning Lanes. Even if you’re only able to knock out 3-4 headliners with the paid FastPass service, Genie+ is arguably worth it at Disney’s Hollywood Studios. We have several recent posts that are helpful on this front, including the following:
Just in case that’s not overwhelming enough, more DHS strategy posts are in the pipeline. I won’t rest until I’ve covered all the ways to conquer crowds at Walt Disney World’s most frustrating park!
…and then I’ll have to redo them all once Fantasmic returns and throws a monkey wrench into things.
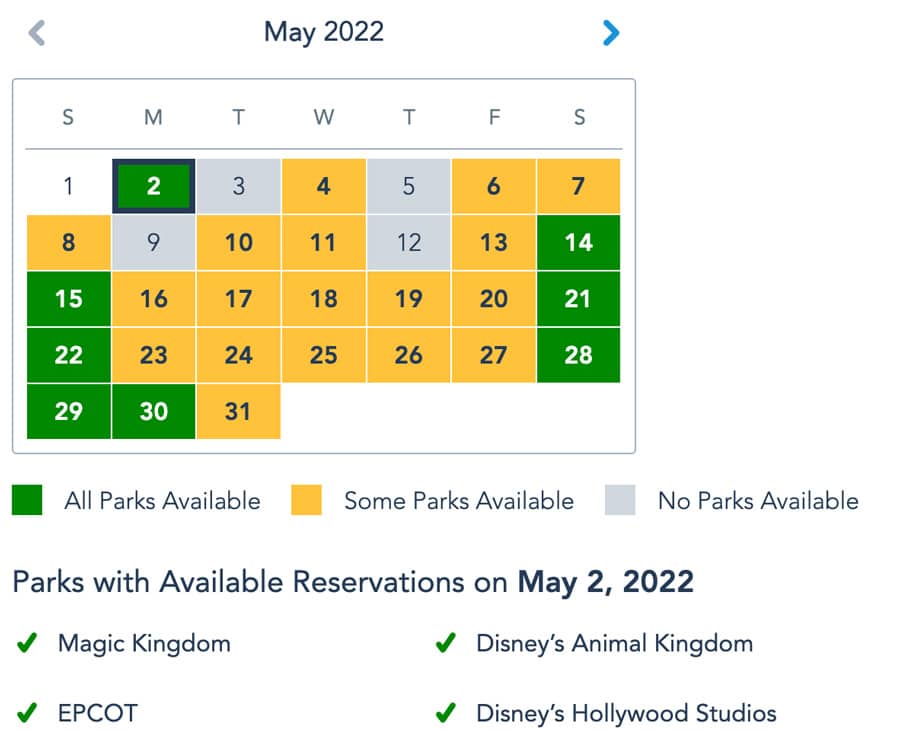
Looking forward, you can expect…I’m honestly not sure. We recently updated the May 2022 Crowd Calendar for Walt Disney World based on incredibly limited Disney Park Pass reservation availability. The reasoning for that is relatively straightforward–all dates that run out of reservations should be equally crowded.
As such, we stated the following: “Crowds could still drop in the coming weeks to their normal 6/10 to 7/10 levels, but we’re no longer predicting that given how many dates are already yellow on the Disney Park Pass reservations calendar. To the contrary, our expectation is that remote work and ongoing pent-up demand will keep the month somewhat elevated. Not as bad as spring break, but worse than a normal May.”

The problem with this reasoning is that most of late April was also yellow or grey on the Disney Park Pass reservation calendar. Yet, wait times dropped across the board in a consistent fashion that cannot be explained away by weather, attraction uptime, or anything else. Crowd levels went from 8/10 to 10/10 most days to a range of 5/10 to 7/10 most days.
Now, it’s possible that meet & greets helped better absorb some of the crowds (keep in mind that most characters don’t have posted wait times, so they get ignored by the data). It’s also possible that the longer hours helped better spread out crowds to some degree. Personally, I find this unpersuasive to account for the entirety of the discrepancy. Some of it? Sure. All of it? No way. Attendance had to have been lower for the last couple of weeks.

Ultimately, I cannot explain why or how that would’ve happened given the (lack of) availability on the Disney Park Pass calendars. It’s possible that potential guests made reservations when they saw them starting to book up, but didn’t follow through with trips.
Another theory is that cancellations have already started to pile up due to the rising costs of gas, airfare, and various other reasons–and those cancelled Park Passes aren’t being automatically added back into the inventory for some reason. If either are true, why wouldn’t Walt Disney World manually adjust the Park Pass system to add capacity? It just doesn’t make sense.
Regardless, wait times at Walt Disney World not being as bad as the Park Pass calendar foretold is a good problem to have. It now makes us a bit more optimistic that May 2022 will once again be “shoulder season” with those 6/10 to 7/10 crowd level days.
The real problem is that we don’t really have any solid foundation for making that prediction aside from past precedent, which has been repeatedly wrong thus far in 2022. Nevertheless, I’m going to roll with it. My prediction is that May 2022 won’t be nearly as bad as the last 3, and could end up being one of the better months of the year when all is said and done. We’ll report back on how things are going at Walt Disney World in a week or two.
Planning a Walt Disney World trip? Learn about hotels on our Walt Disney World Hotels Reviews page. For where to eat, read our Walt Disney World Restaurant Reviews. To save money on tickets or determine which type to buy, read our Tips for Saving Money on Walt Disney World Tickets post. Our What to Pack for Disney Trips post takes a unique look at clever items to take. For what to do and when to do it, our Walt Disney World Ride Guides will help. For comprehensive advice, the best place to start is our Walt Disney World Trip Planning Guide for everything you need to know!
YOUR THOUGHTS
Thoughts on crowds in the second half of April 2022? Predictions on crowds for May 2022? Think that this month will end up being significantly less busy than February through April, or are the moderate crowds of the last couple weeks a red herring? If you’ve visited within the last month, what did you think of crowds and wait times? Any parks or times of day noticeably worse than the others? Do you agree or disagree with anything in our report? Any questions we can help you answer? Hearing your feedback–even when you disagree with us–is both interesting to us and helpful to other readers, so please share your thoughts below in the comments!
